Data Flow
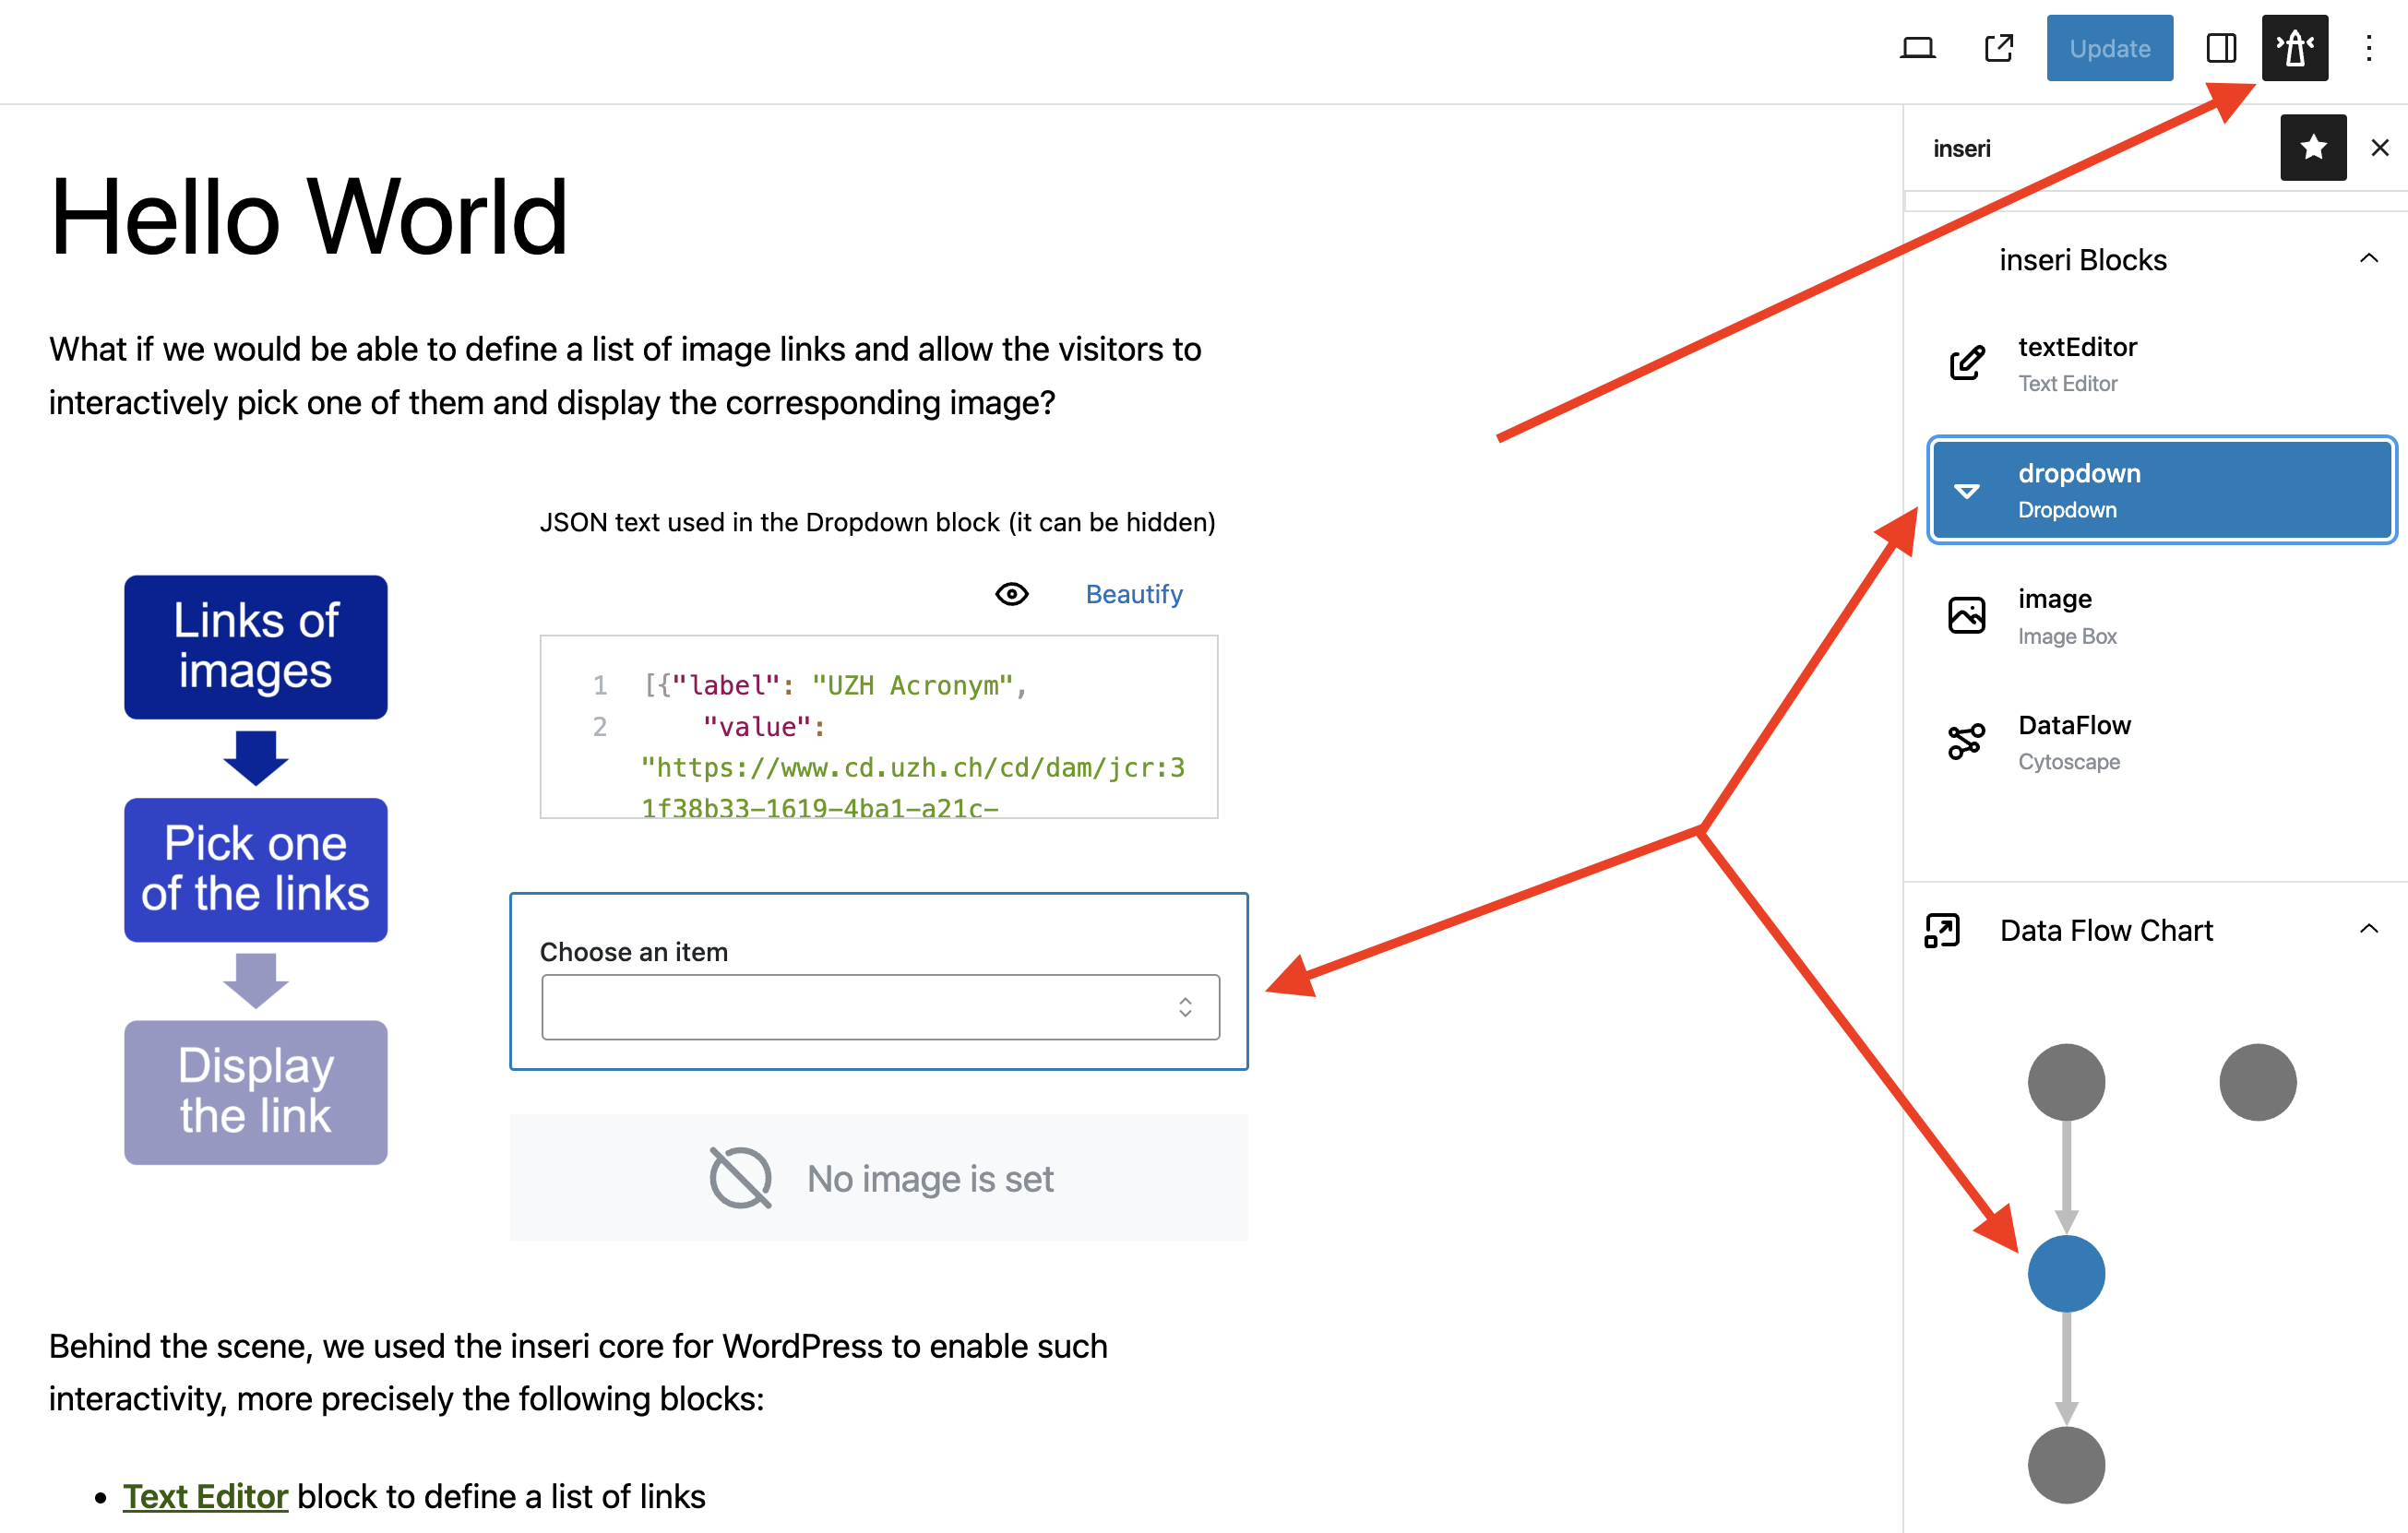
inseri Data Flow is available in the inseri Sidebar and provides an overview of the used inseri blocks and their dependencies via a corresponding directed acyclic graph (DAG).
The inseri Blocks section provides all inseri compatible blocks, and the Data Flow Chart section provides an overview as a directed acyclic graph (DAG) where the inseri blocks are represented as nodes and the edges correspond to the data. There are several actions that the user can perform:
- by hovering a block from the inseri Blocks section, the corresponding node from the "Data Flow Chart" section is highlighted (the margin changes from grey to dark grey).
- by selecting a block from the inseri Blocks section, the corresponding node from the "Data Flow Chart" section is selected (the color changes from grey to blue). Moreover, the block is highlighted also in the working area.
- by hovering a node from the Data Flow Chart section, the corresponding block from the "inseri Blocks" section is highlighted.
- by selecting a node from the Data Flow Chart section, the corresponding block from the "inseri Blocks" section is selected. Moreover, the block is highlighted also in the working area.
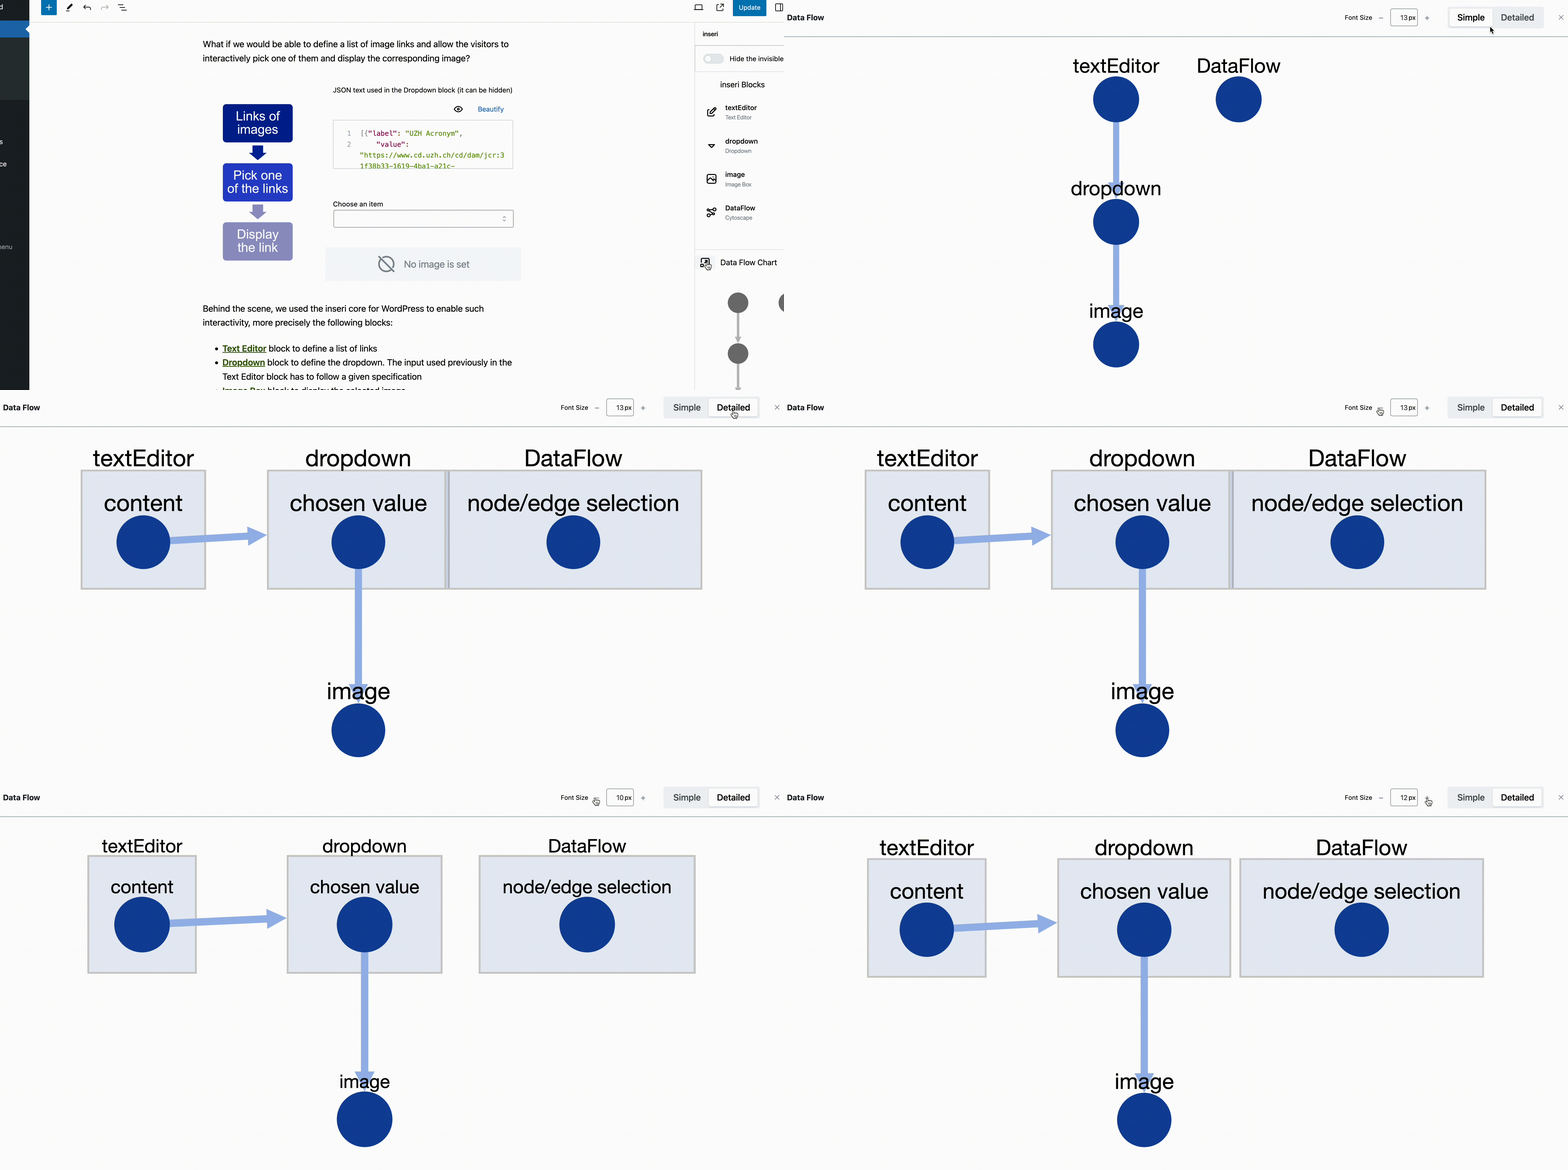
By clicking on the icon before "Data Flow Chart", a popup with the DAG is displayed where the name of the blocks is shown. By using "Show Details" (top right) a more complex diagram is displayed where one see exactly which data from a given block is used. You can control the font size (the value in top right is editable) and the position of the nodes.
A similar example can be obtain by following Hello World tutorial.

